You are here
Week 7: Following the Script and Counting Cells
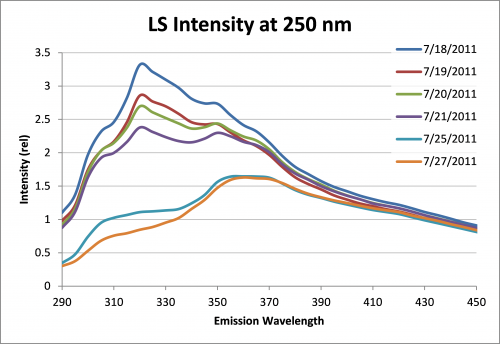
This week brought another round of long days sampling data, but the data processing has been eased by my completion of a MATLAB script to correct the EEMs automatically. I ran the biodegradation samples through the fluorometer on Monday and Wednesday, and we're starting to see some exciting results - at least one of the oils is showing a significant decrease in some of the fluoroescent peaks, indicating that the bacteria are indeed breaking down the PAHs as we had hoped.
This week I also started using the flow cytometer to get cell counts from the samples that have been preserved over the duration of the biodegradation experiment. Neither myself nor my mentor has used one of these before, so there's been a definite learning curve, and we don't have any exact results yet. It's been fun learning to operate the new instrument though, and I'm excited to see what we find out from it. The flow cytometer uses laser beams to enumerate particles passing through in a stream from a liquid sample. The scatter of the light and the intensity of fluorescence of particles in the stream are used to identify the number, size, and shapes of cells. We're using this tool to quantify the growth of our oil degrading bacteria. Every day I've run the fluorometer tests I've also been preserving samples of the water to run through this instrument.
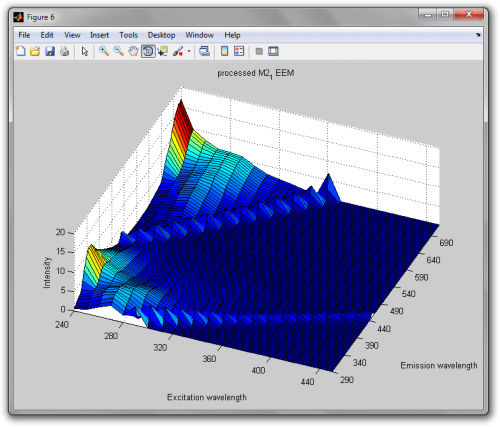 The data processing script I developed is an exciting tool, because it drastically reduces the time required to see the results from the fluorescence experiments. The script is also very easy to use - it just requires selecting the input data files from the fluorometer and absorbance spectrometer, and then automatically calculates corrected EEMs and generated 3D graphs. I still have to process the finished EEMs to make the graphs above, but that process is fairly quick and must be tailored to each graph, so it's not as easily automated. Depending on how much time I have, I may make some further changes, but so far it seems to be working quite well.
This week wasn't all work though! On Thursday we took a trip to Astoria to see CMOP's field station on the Clatsop Community College's MERTS campus. I really enjoyed seeing some of the sensors and technology used in CMOP's monitoring network, and hearing all about how they are developed, deployed and maintained. It was also interesting to learn more about how the remote sensing initiative started there helped CMOP become an NSF science center. After the visit, we got to see some of Astoria and drive across the long bridge, enjoying the unusually sunny day at the mouth of the Columbia.
Next week I'll be running more samples, and hopefully getting the flow cytometer data to mean something. I'll also be giving a practice presentation of my final presentation to our lab group Friday, which means the end of my internship is fast approaching. It's been a lot of fun, and I've learned more than I ever would have expected. There's still a lot to do in the next three weeks though, so it isn't over yet!