You are here
Week 4: Excelling at data processing
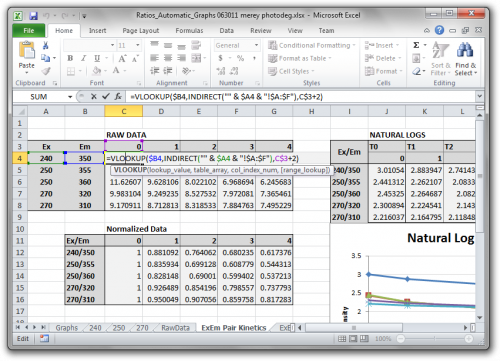
This week I spent a lot of time in Excel, processing the data from last week's solar degradation experiments. I also prepared for our mid-term presentations which are happening on Monday. There wasn't much lab work to do, but next week we'll be running more PAH calibration tests, so I did some prep work in the lab.
My previous internship was all about developing a data processing application so that we wouldn't all have to spend so much time in Excel processing data, so naturally, I've been looking for ways to make processing these data more efficient as well. We are interested in studying certain excitation/emission pairs to see how they change over time. If the peaks decrease uniformly, that indicates that the PAHs are being degraded over time. Calculations to help verify this include determining the rate constant for the degradation, locating key Ex/Em pairs, and determining the ratios between similar peaks. To speed up the process, I figured out how to create equations in Excel so that we can now enter an Ex/Em pair, and the values will be looked up from the EEM spreadsheet, without having to manually select the data range.
So far, the results look good - as expected, photodegradation caused decreases in key Ex/Em pairs. It will take more time to analyze the results, and we still haven't performed most of the calculations. After next week's additional PAH calibration tests, there will be some more data processing, and I will be learning about GC/MS, which we will be using later.