You are here
VIII: The effects of sulfate and salinity in persulfate decay kinetics
This week I made a vast number of dilute Instant Ocean and sulfate solutions. I conducted persulfate decay studies for each of these waters at 70° C with 5mM initial persulfate concentrations. Here, I show the normalized decay curves with observations and conclusions:
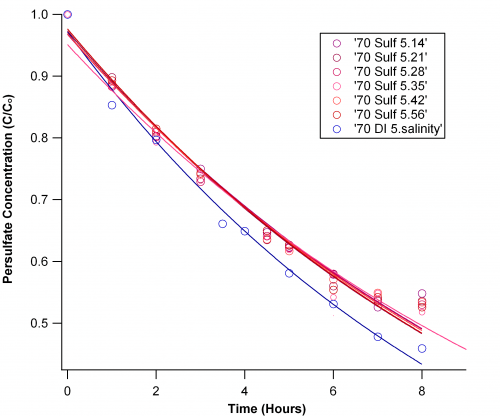
The Sulfate Study:
I varied sulfate ion concentration from 0 to 56 mM, centering around the average ocean value 28 mM. I was very careful to use magnesium sulfate because the other transition metal salts make collored solutions that may affect my measurement, or they are known activators that would interfere with the persulfate chemistry.
Looking at the graph below, it is easy to see that the presence of sulfate ions slows persulfate decay, but there is little differentiation between concentrations.
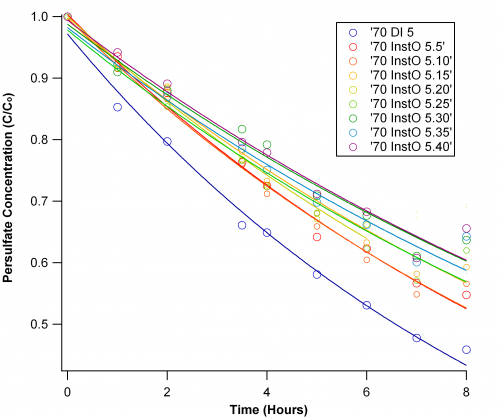
The Salinity Study:
I varied the Instant Ocean salts from 0 to 40 g/L in increments of 5. This was fairly straightforward, but there may have been contamination at hour 7 because the data for hour 8 is a little strange.
The curves reinforce that the presence of ions makes a considerable difference in persulfate decay. Increasing salinity slows decay, but the rate constants show that it is not a linear relationship.
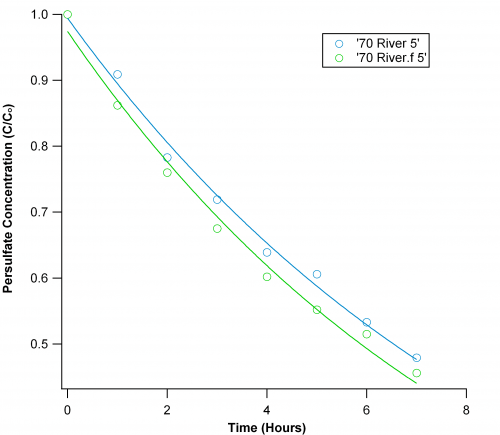
River water:
For this sample, I just used filtered and unfiltered water from the Willamette River (Many thanks for Marisa Freider for collecting it!). Contrary to my expectations, persulfate showed slower decay in unfiltered water. It remains to be seen whether this is an exception. Also, this river water shows kinetic quite similar to DI water.
Note: all my comparisons are based on the quantitative comparisons of rate constants extracted from these decay curves. The different intercept for these curves may be somewhat decieving. Nevertheless, they are true first order decay curves.
*Edited 8/13/2010 after the original posting was lost in cyberspace!