You are here
III: Calibration Curves for persulfate in deionized water and Instant Ocean water
Calibration curves are an excellent asset to analytical chemistry; most often they are the key to calculations relating the absorbance of a solution to the concentration of colored reagents in solution. Since all subsequent calculations are based on the calibration curve, it's worth one's time to make sure each one is accurate.
Last week a number of diagnostic scans showed 352 nm as a reliable absorbance maximun for persulfate-KI solutions. Therefore, only single reads of absorption at that wavelength were necessary for making the calibration curve, rather than time consuming scans. But after spending most of the day acquiring calibration data from a conventional Perkin Elmer spectrophotometer for just DI water, I switched over to the Gilford Spectral III. Instead of taking 2 minutes for reading and rinsing the cuvette of each sample, the Gilford requires only 20 seconds each sample; it uses a vaccuum system to load each sample. I typed the readouts directly into a data file that could be used in analysis. Overall, it is an excellent timesaver, and it has excellent potential for future kinetics studies.
The results of my data collection are shown below. I was surprised by the similarity between DI and Instant Ocean water; I expected a more drastic difference, but I think this works to our advantage.
C.Liang et al. (2008) published a calibration curve of persulfate in DI water using essentially the same iodometric method applied to spectrometry. However, their equation A=0.1179x (where A is the measured absorption and x is the persulfate concentration in mM) is very different from my results shown below. I am curious to find an explanation for this.
From here I hope to test the interferences for this KI-persulfate method and complete my data on temperature and pH effects. Meanwhile, I remain suspicious of this method's susceptibility to other oxidants. I continue to research other possible methods to use.
Figures:
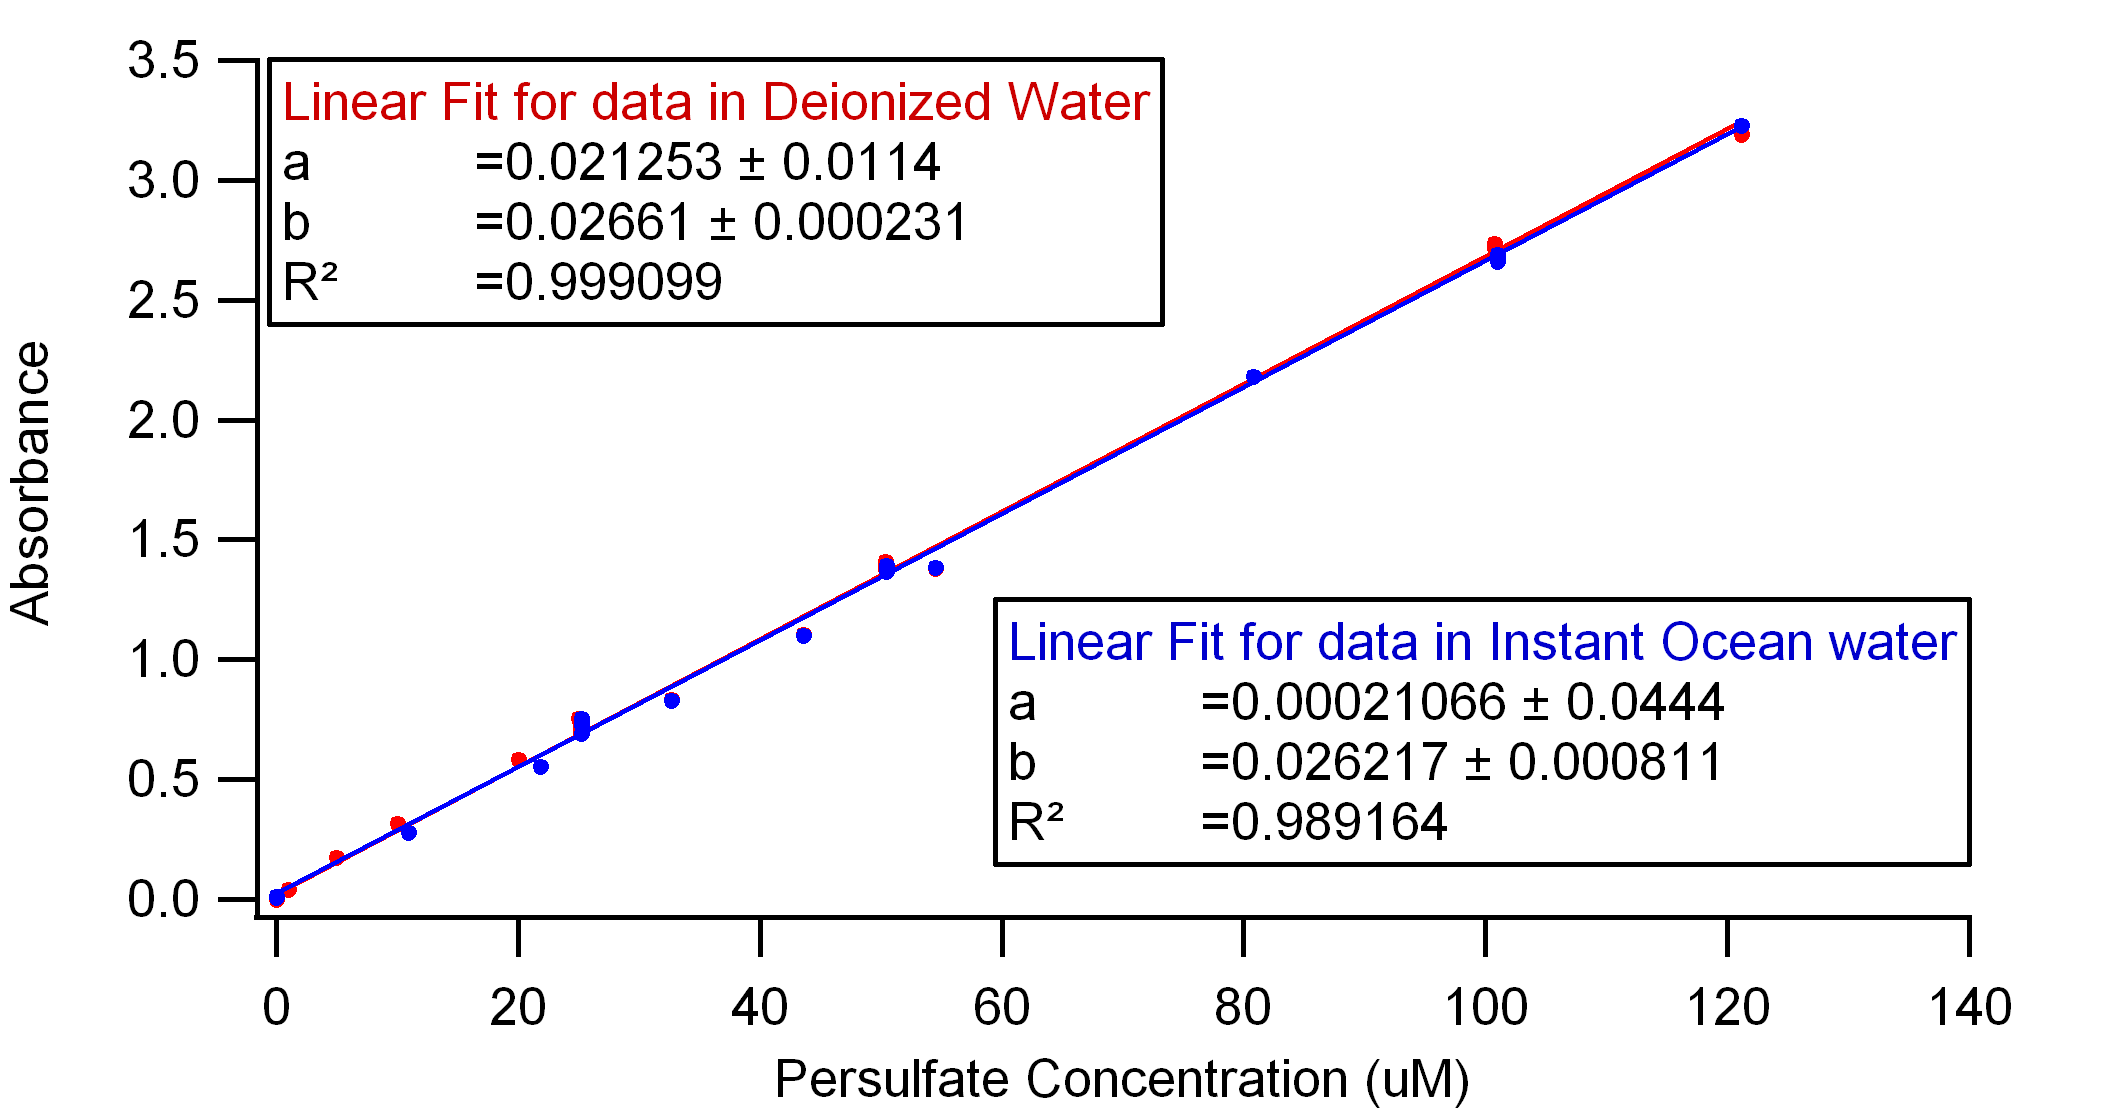
Figure 1. Calibration curve for Persulfate in DI and Instant Ocean waters, measured at 352 nm and 22-23° C with a neutral pH.
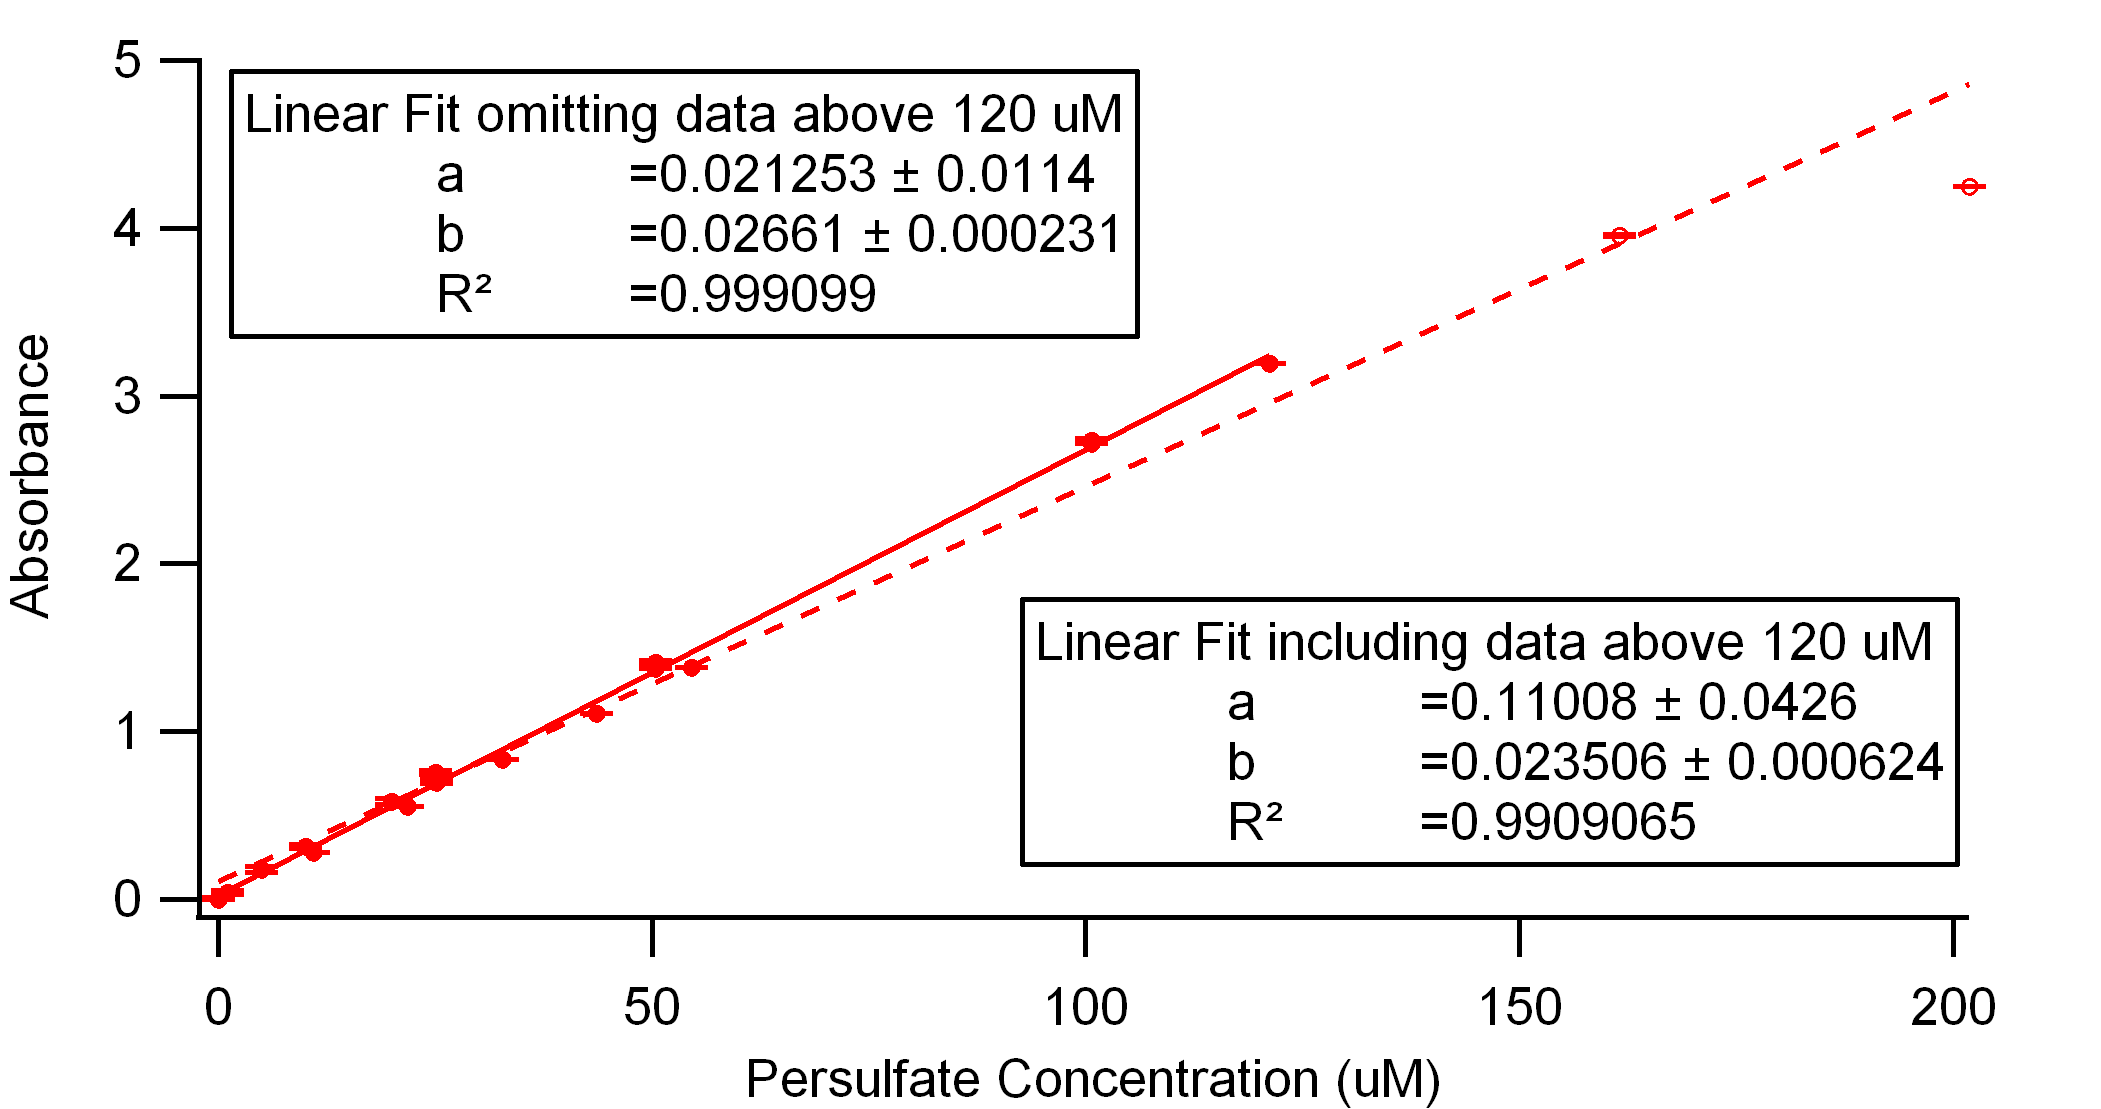
Figure 2. Comparison of calibration curves in DI water including and omitting the data above 150 uM, indicating the higher concentrations exhibit a deviation from linearity.
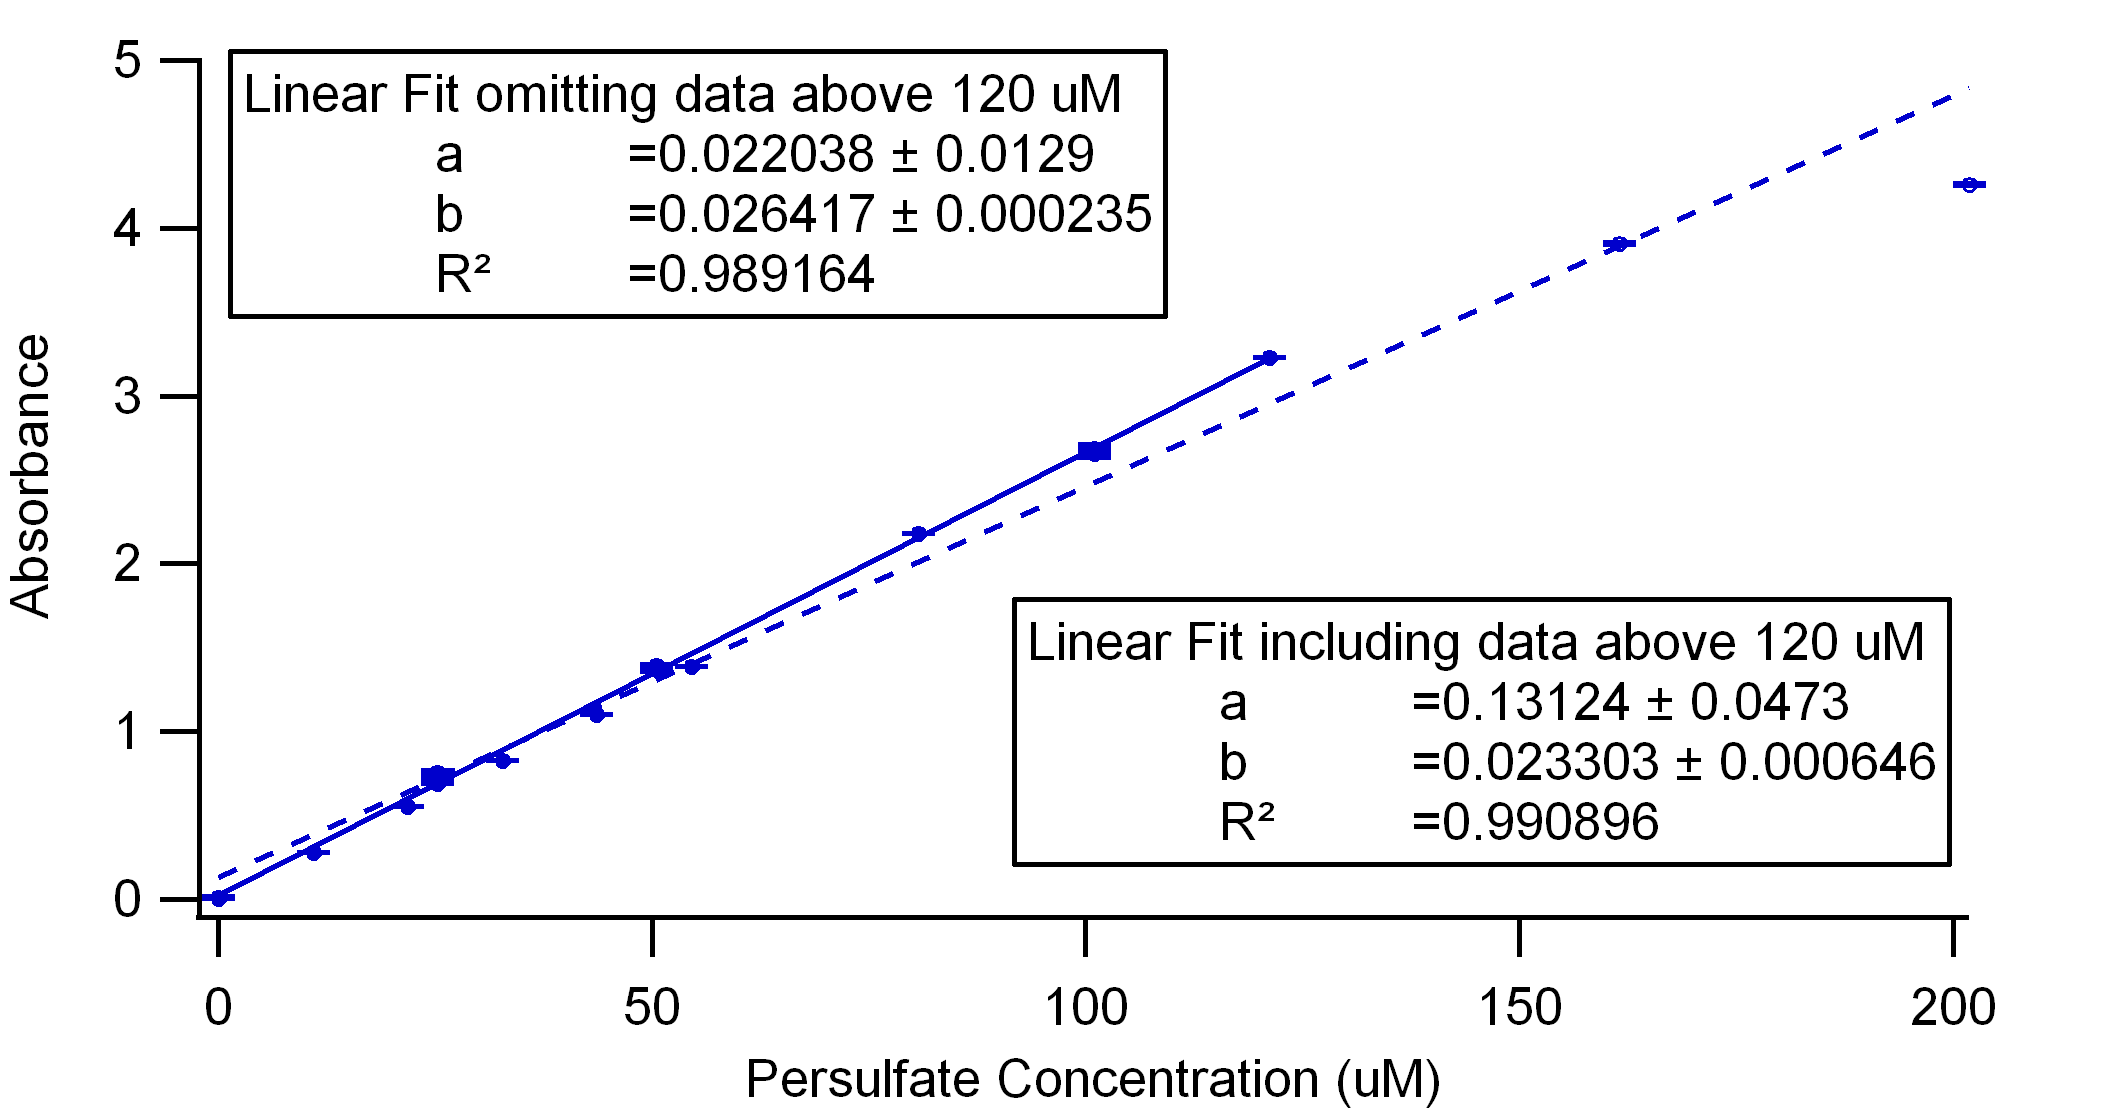
Figure 3. Analogous to Figure 2, this is a comparison of calibration curves in Instant Ocean water that include and omit absorbance data above 150 uM. Likewise, there seems to be a deviation from linearity at higher concentrations.
.jpg)
Firgure 4. This collection of scans and a calibration curve, published by Liang et al. (2008), form an interesting point of comparison for Figures 1-3. His caption states: "UV absorption spectra of the iodometric persulfate measurement system. Solutions measured include [persulfate]=0.05 mM (pH 5.5), [KI]= 60 mM (pH 8.4), [NaHCO3]=70 mM (pH 8.1), ... , [persulfate/NaHCO3/KI]=0.05/70/60 mM (pH 7.8). The only difference between our methods is that Liang uses bicarbonate to reduce "oxygen oxidation". However, he does not seem to label the green curve below KI. Perhaps it matches his description for [NaHCO3/KI]=70/60mM (pH 7.8).
References:
C.Liang, C. Huang, N.Mohanty and R.M. Kurakalva. Chemosphere, 73 (2008) 1540-1543.