You are here
IV: Extra UV/Vis Absorption scans
Recognizing certain discrepancies between my data on persulfate and that published by Liang et al. (2008), I've been returning to a couple initial diagnostic scans from the project. Below I've included key figures with additional comments.
Figures:
.png)
Figure 1. UV/Visible absorption spectra of the iodometric persulfate determination method. These were conducted under the same conditions described by Liang et al, and they more-or less match the ones they published, shown below in Figure 3.
However, the concentration for KI seems to be misreported. That is, the article describes using 4g KI (MW=166 g/mol) in 40 mL. This calculates as 0.600 M =600 mM KI, rather than their reported 60 mM. I have continued with the 600 mM procedure.
In contrast to the KI spectra published by Liang et al., scaning the 606.8 mM KI solution did not yeild and peaks around 350 nm. Since KI is known to photooxidize, that may be the reason for their elevated solutions, in which case they'd need to subtract that value from the absorbances they use in the calibration curves. This may effect the dramatic differences in slope between our calibration curves.
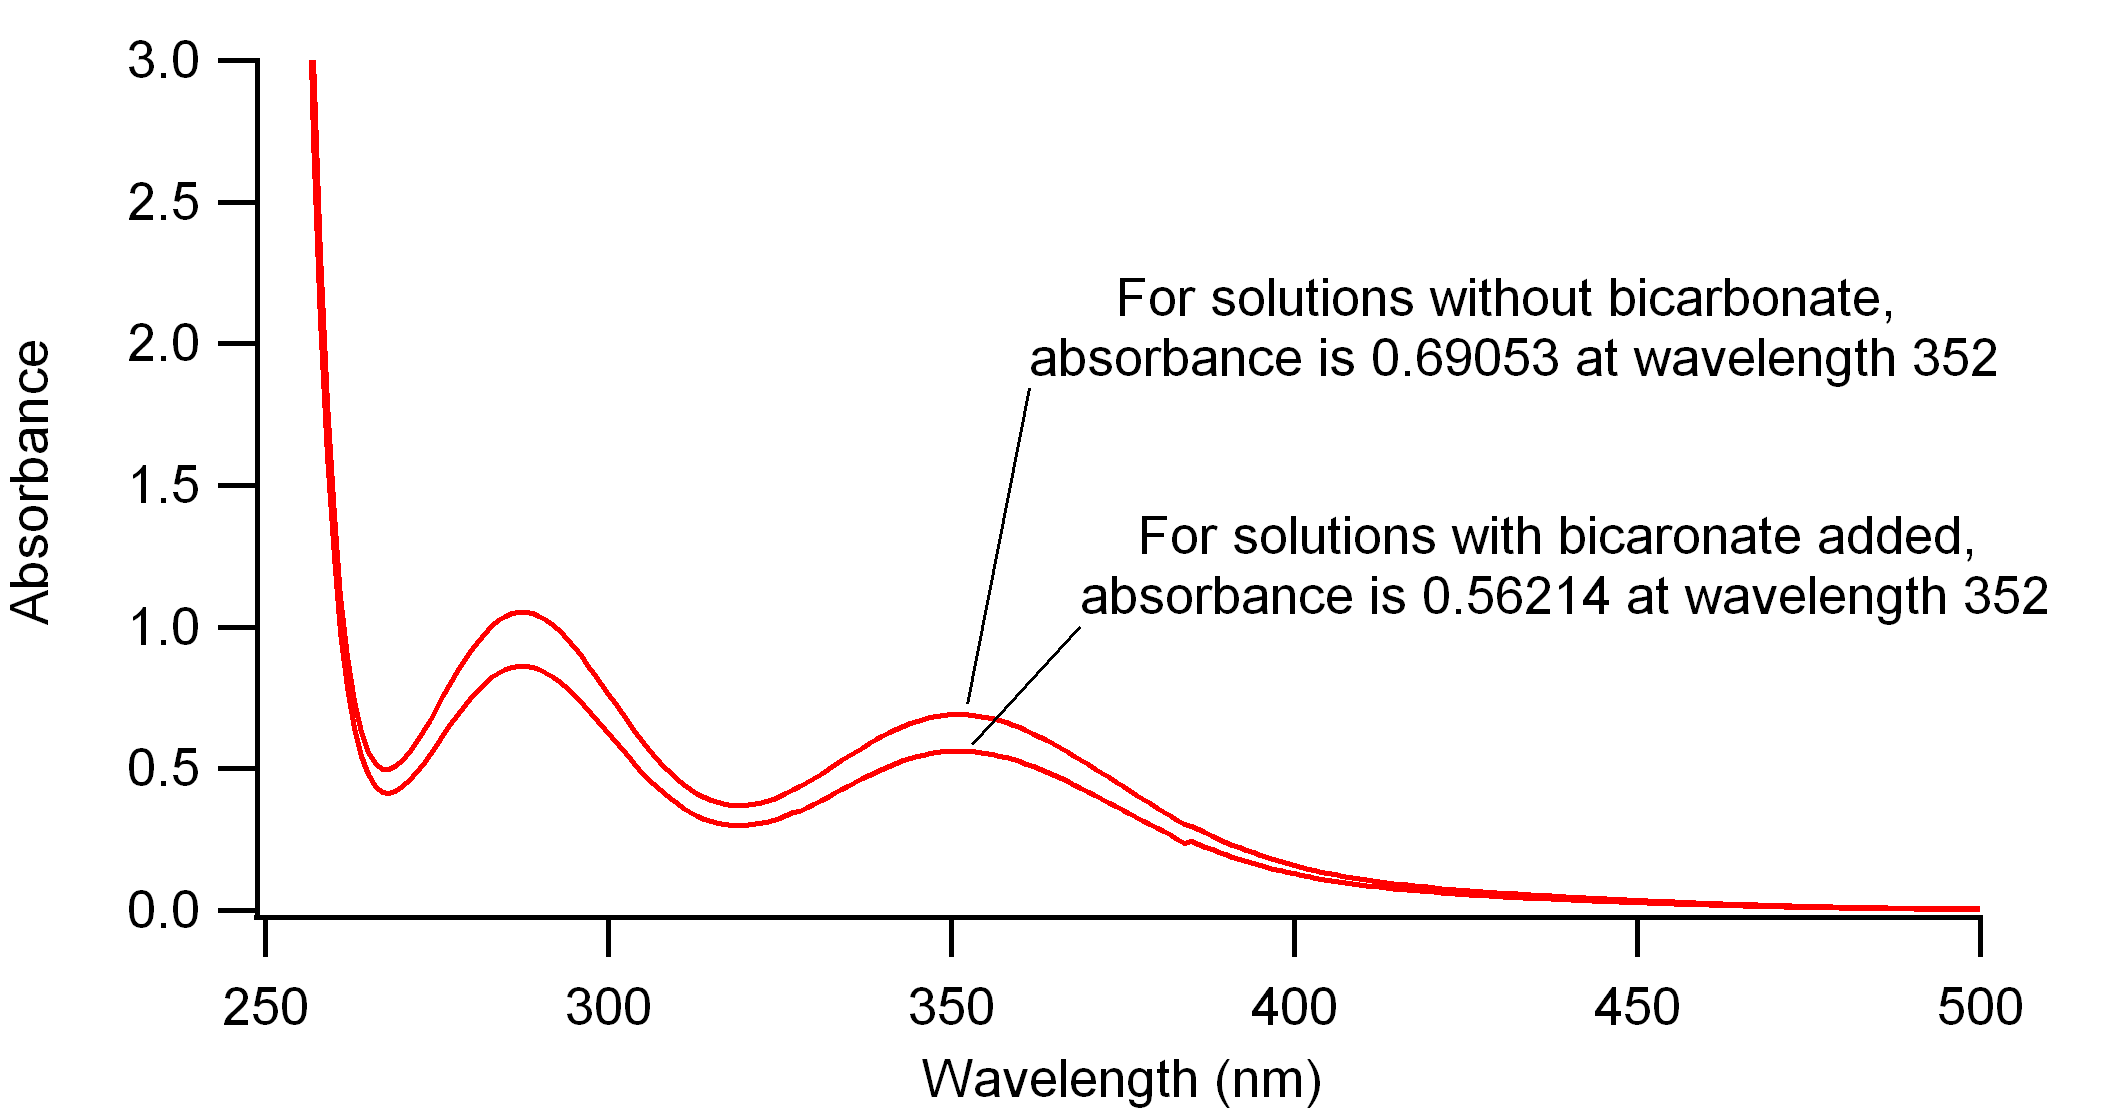
Figure 2. UV/Visible absorption spectra for reacted solutions of persulfate and KI, following the iodometric method of determination for persulfate. Liang et al. followed an original Kolthoff reference for using bicarbonate in the solution. By these scans it appears to somehow reduce the amount of I2 formed in solution. I've followed another reference by Frigerio, which does not use the bicarbonate.
.jpg)
Figure 3. UV absorption spectra and calibration curves published by Liang et al. (2008). Further description is found in the previous blog (III). One thing I have not previously mentioned is that Liang's calibration curves go beyond 120 uM of persulfate, which is where there seems to be a deviation from linearity. With the above typo for KI concentration, I wonder if there is another issue underfoot for the persulfate concentrations.