You are here
Week 4: nZVI detection- conflicting data
I have gathered more data this week to draw a reasonable/firm conclusion before I started narrowing down my focus.
I re-did older experiments because I started gathering data at higher frequency than before (Before: 1-1,000 Hz, Now: 1-10000 Hz) as higher frequency gives more distict data set.
In older experiments, the nZVI in deoxy condition did not provide much signal, which led me to think that I should focus on detection of Iron Oxides to detect the nZVI concentration. However, it seems that at the higher frequency, nZVI in deoxy condition also gives a good phase-shift in the Induced Polarization graph (Phase Shift vs Frequency):
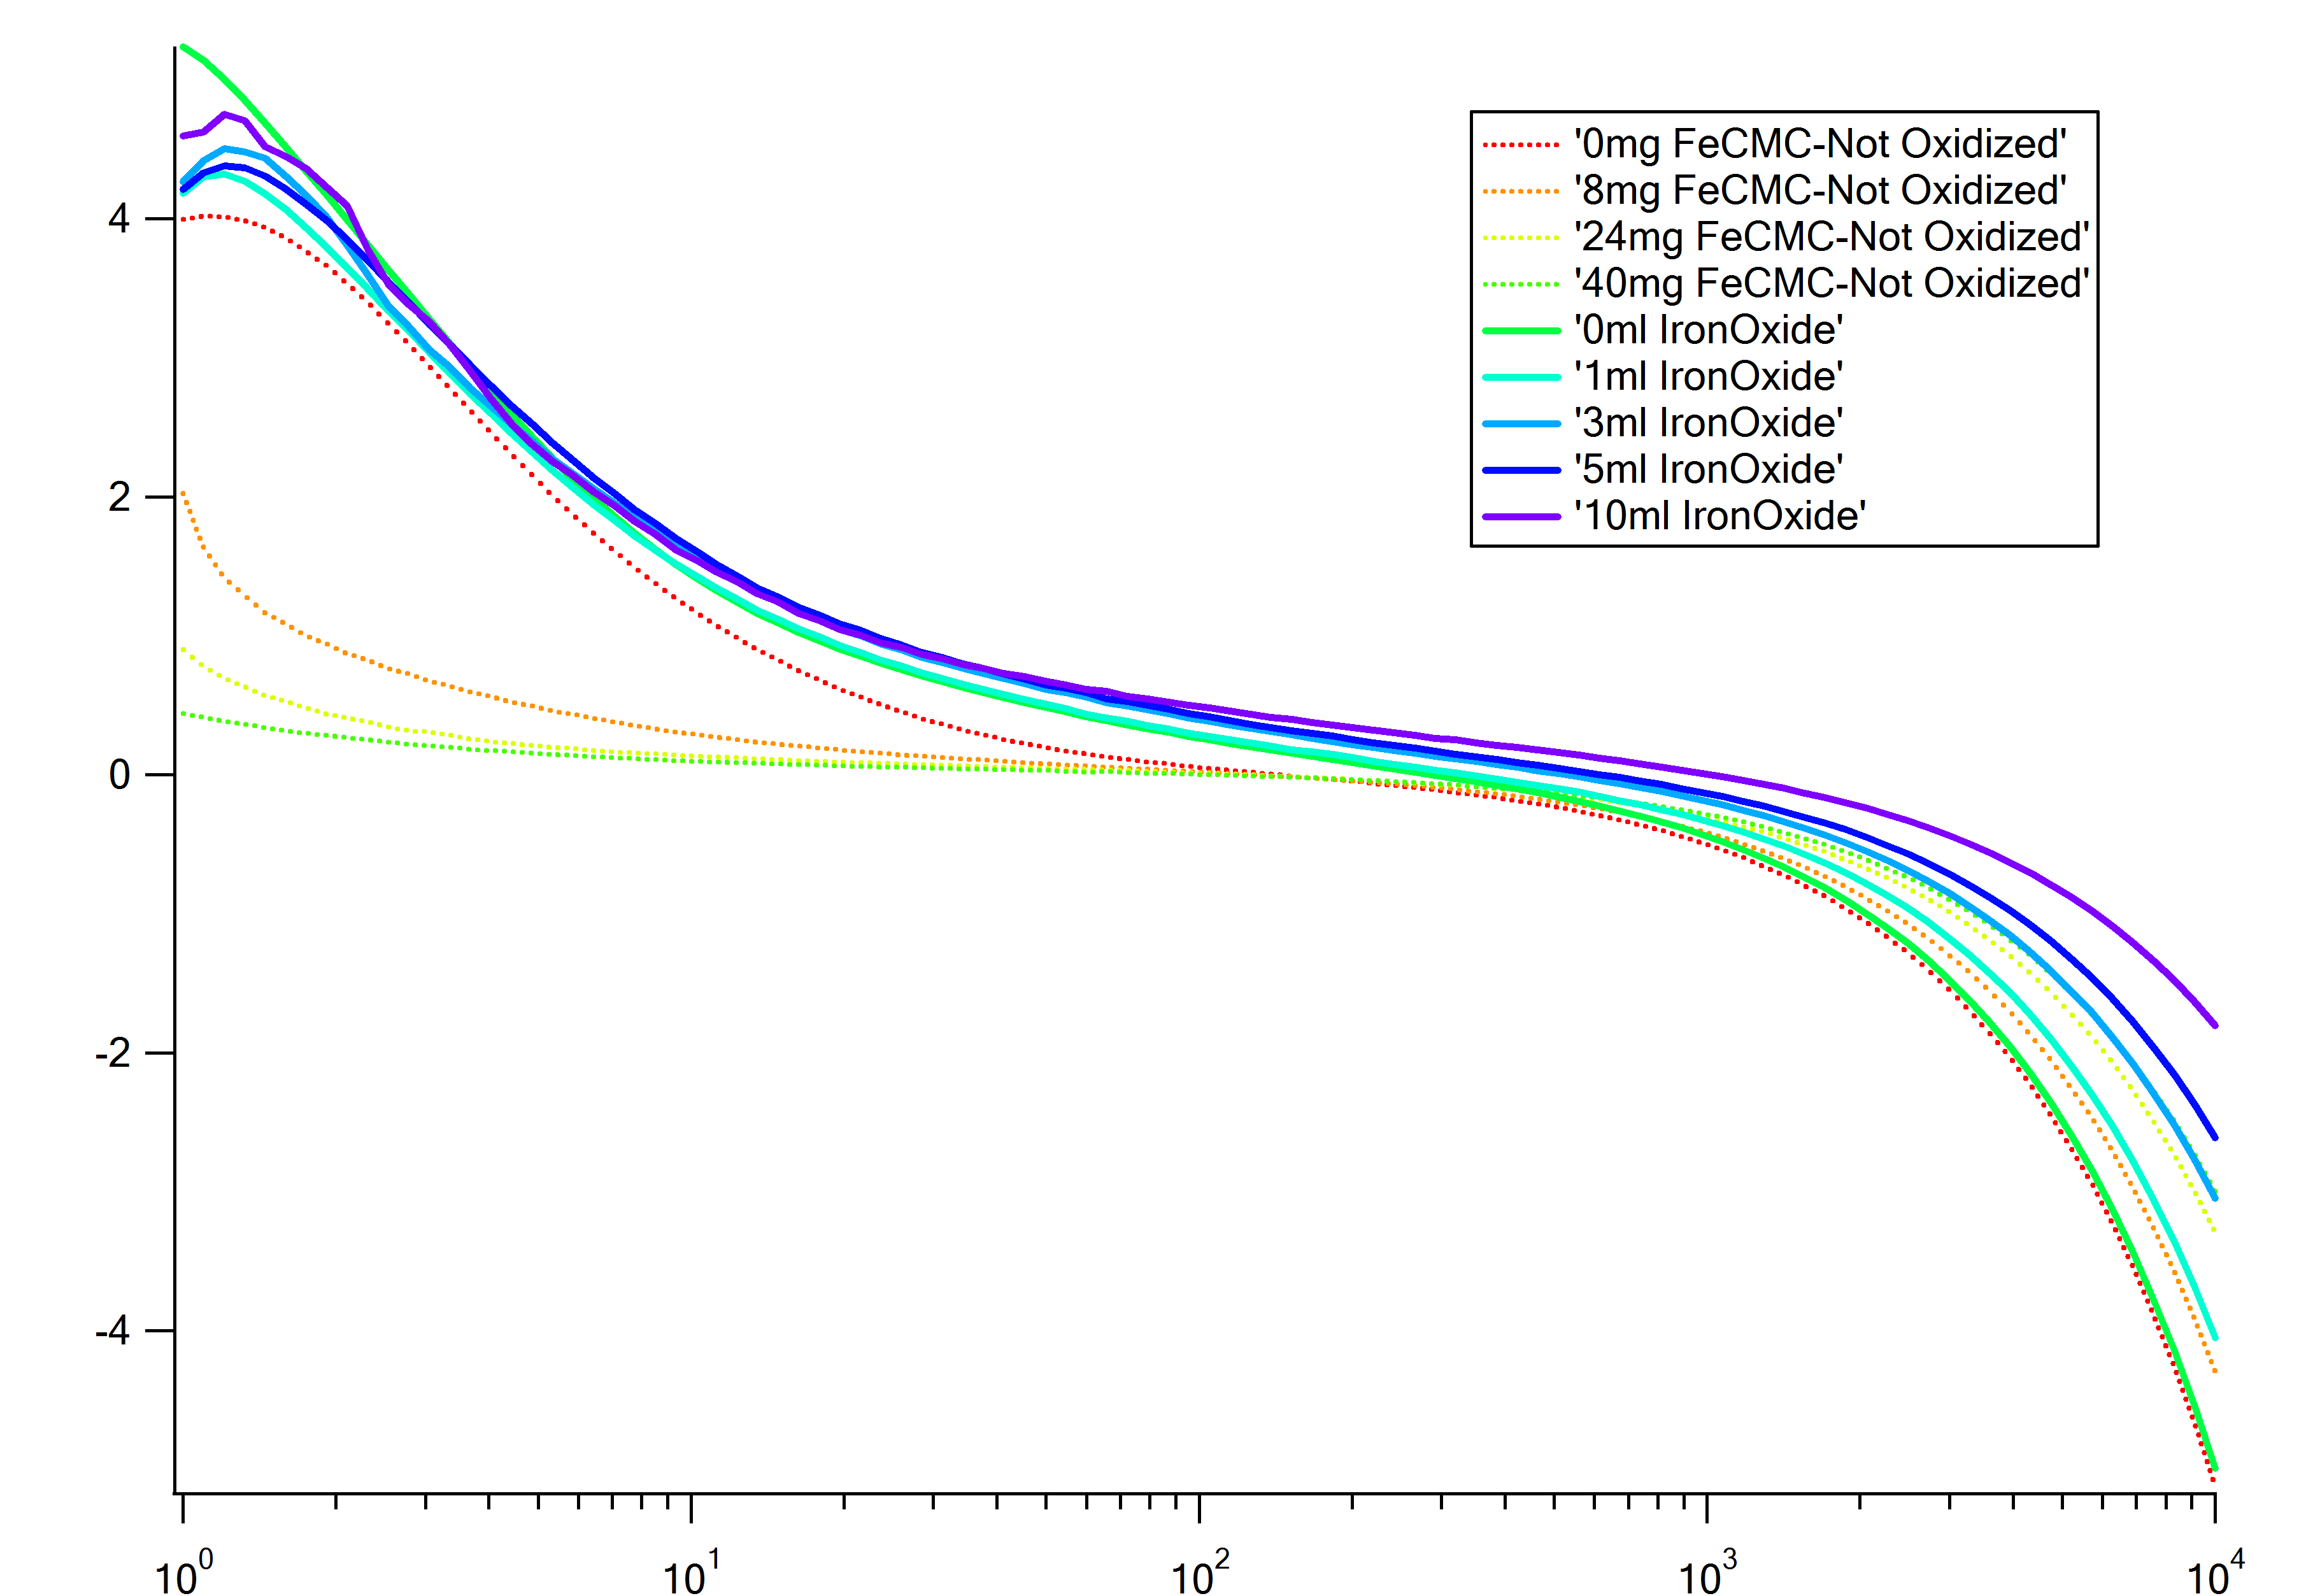
As shown on the graph, even though the degree of shift is not as distinct,
nZVIs do cause phase-shift.
Also, this provides a linear graph when graphed Phase-Shift vs Concentration on a logarithmic scale:
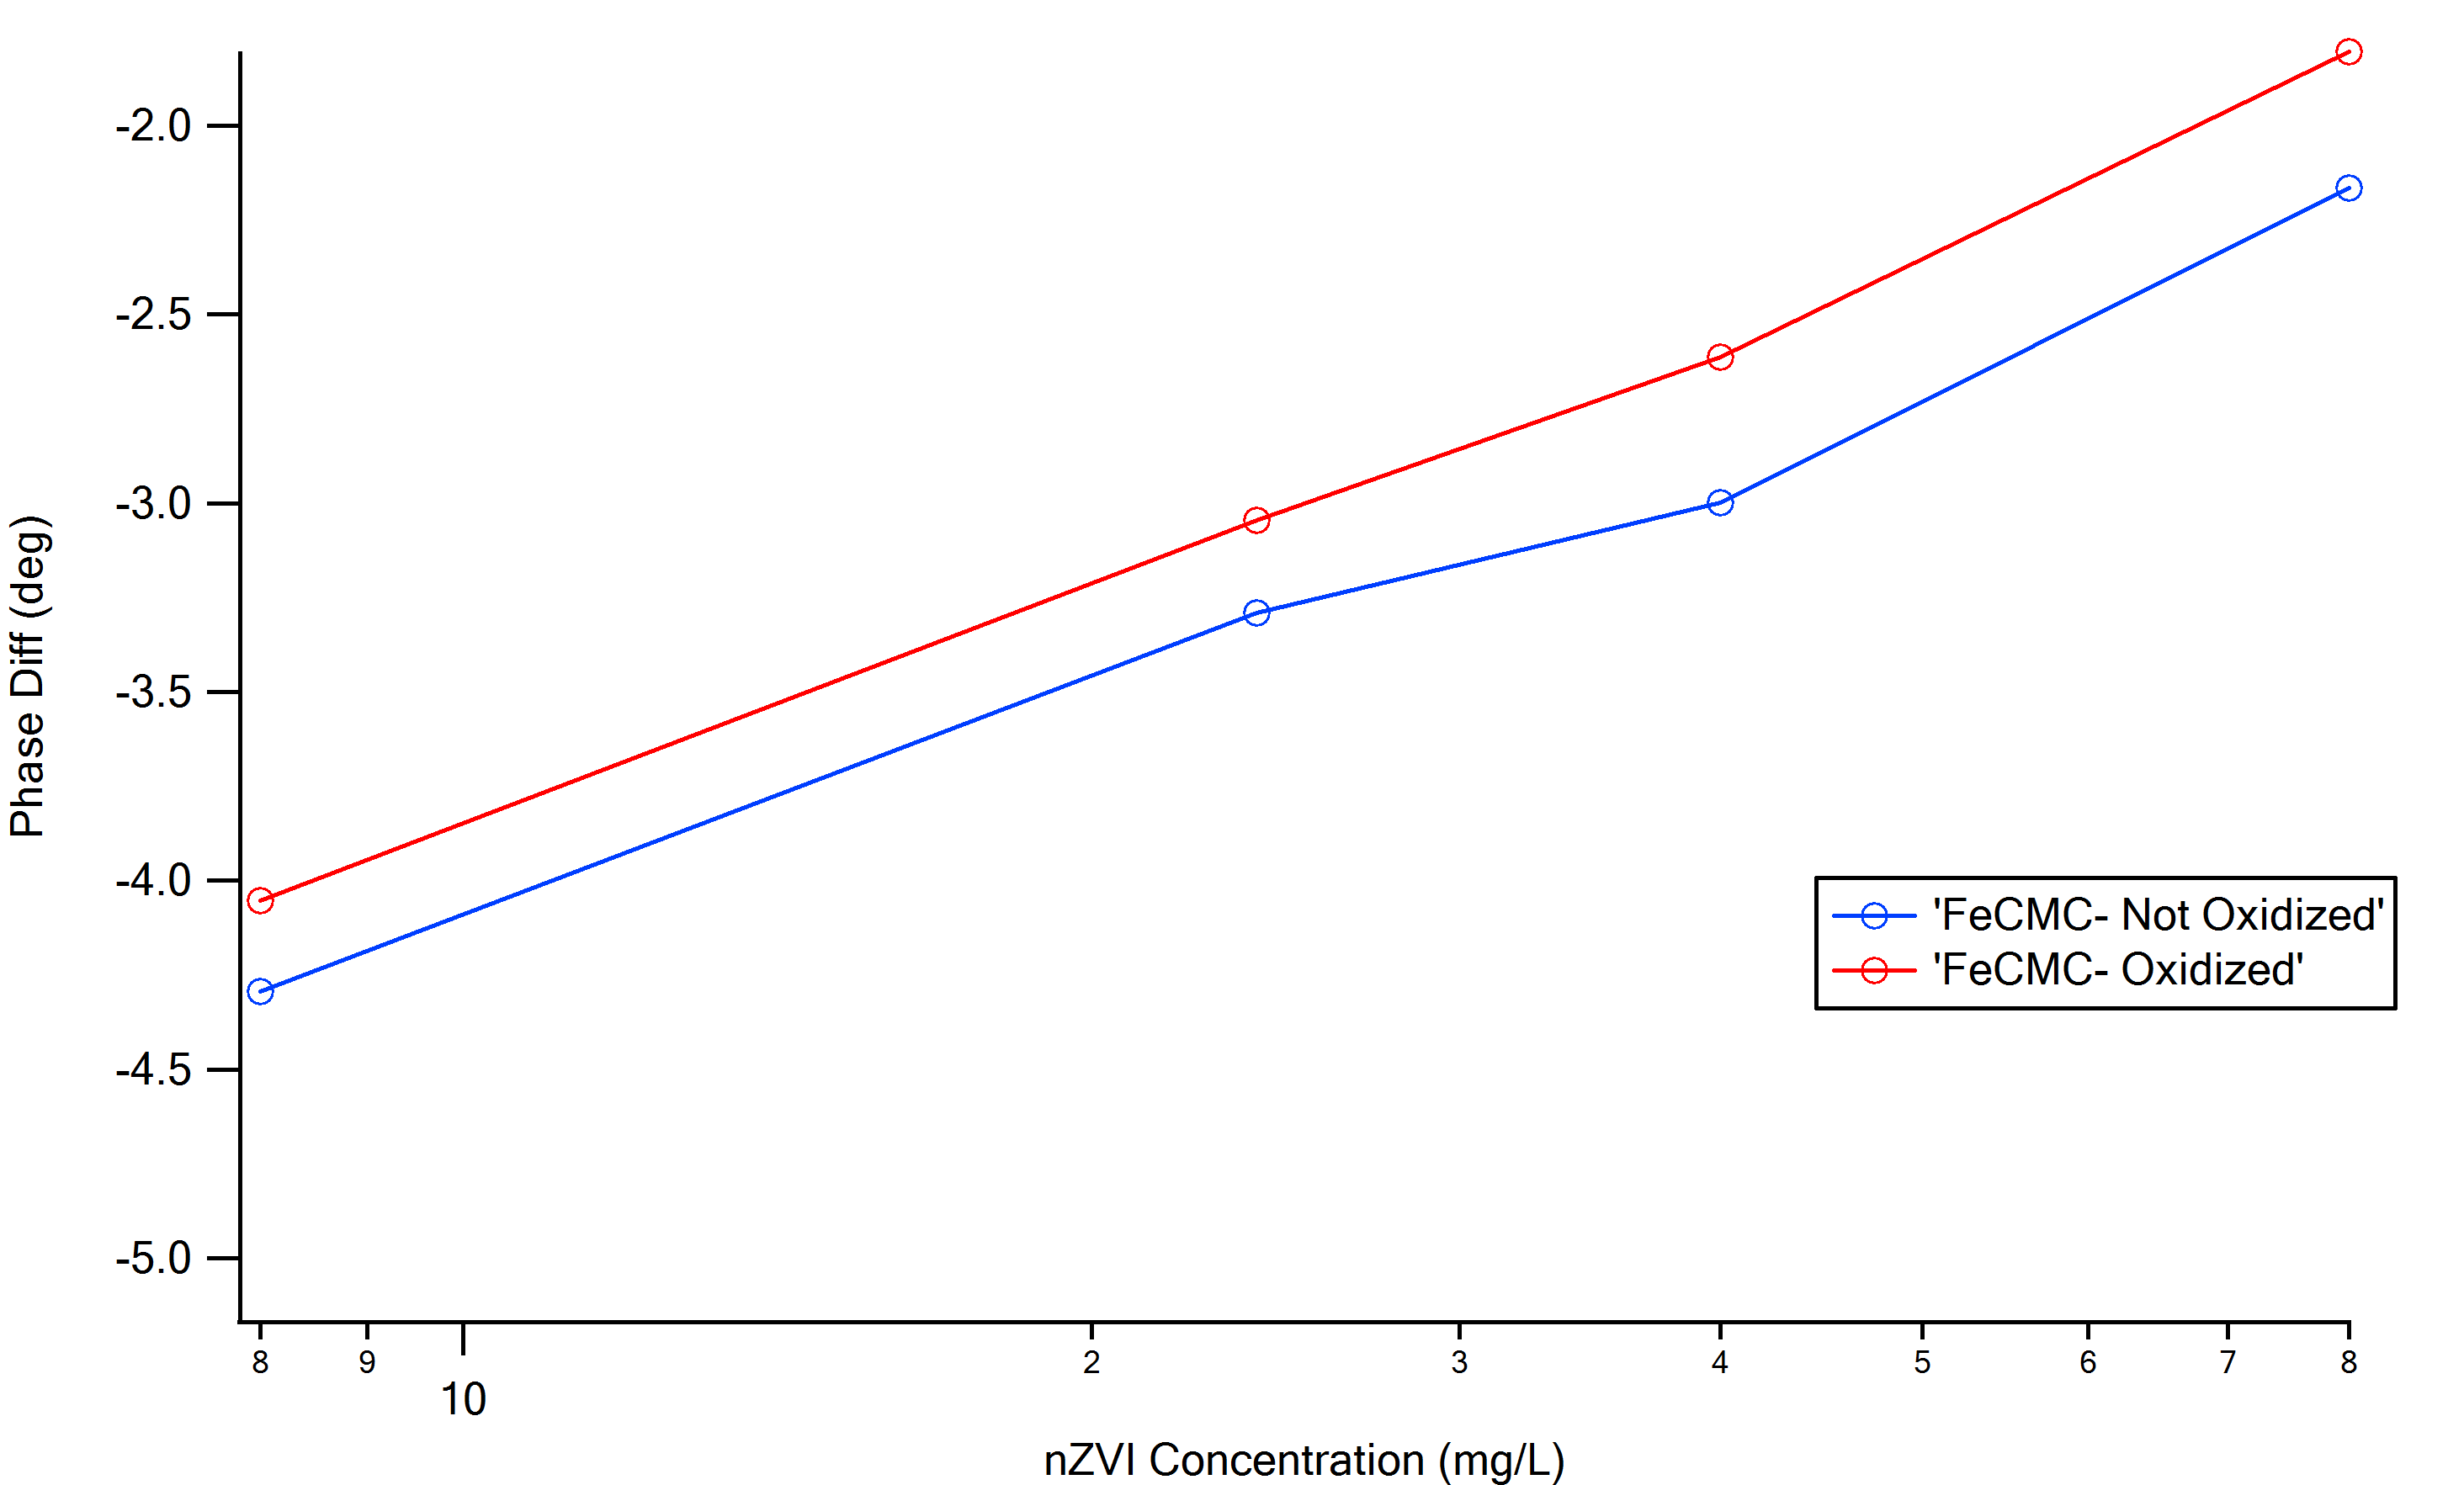
There is a slight y-value offset, but the slope looks almost exactly the same. I need to investigate this matter more carefully.
For rest of the week, I will be going back to the older experiments, perhaps re-doing them to find a concrete starting point.